2026 Home Services Marketing Trends - What's Changing

AI search, agentic booking, and mobile-first behavior are reshaping how homeowners find and hire pest control and lawn care services. This year, it's primarily about building your brand, making it accessible to AI, and meeting customers where they are. Here's what matters in 2026 and how to adapt.
2026 Quick Hits
- AI Overviews: 13-18% of Google queries now show AI-generated answers. Homeowners are saying, "The AI recommended you" when booking.
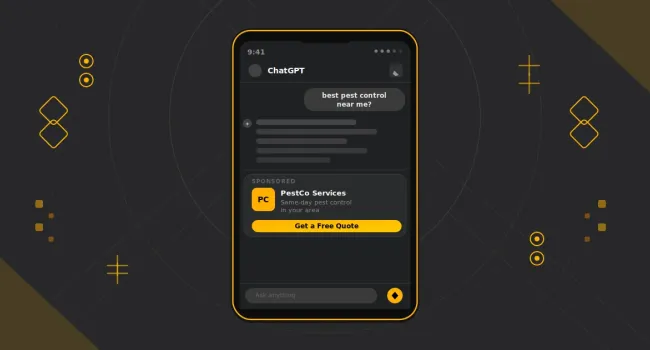
- Productivity Chatbots: Customers are spending more time getting work done in tools like ChatGPT and Claude, and these bots are directing them to a diverse set of channels.
- SEO isn't Dead: AI search is changing the game, but the game isn't going anywhere! Technical SEO is more important than ever.
- Agentic AI: By 2026, AI won't just answer questions—it will book and pay for services autonomously.
- Mobile Dominance: 60-65% of searches happen on mobile. Friction kills conversions.
- Market Growth: U.S. pest control hit $26.1B in 2025; lawn care projects $60-80B by 2030.
- Sustainability Required: Eco-friendly options are now standard expectations for customers.
AI Search: How Homeowners Find You Now
58% of Google searches end without a click—AI provides the answer directly. If AI tools aren't recommending your business, competitors get the call.
What customers actually search:
Before: "pest control [city]."
Now: "I see sawdust and small holes in my baseboards. What is it, and who can fix it today for under $200?"
Then, the AI matches the customer with a company that matches their unique search profile; every search result is highly specific to that user.
Optimize for AI Answer Engines (AEO)
- Check server logs: Optimize for query fan-outs across dozens of related micro-intents and formats. 95% of subqueries have no search volume!
- Structure for machines: Use clear headings and FULL server-side schema markup (e.g., FAQPage, LocalBusiness) to achieve a 20-30% higher citation rate.
- Answer questions completely: Write detailed "What to do if..." guides that AI can cite
- Show pricing: AI prioritizes transparent cost information
- Keep your pages up to date with the latest facts, pricing, and reviews, especially blog posts, where 70% of page views occur in the first 30 days.
- Verify everywhere: Accurate listings on Yelp, BBB, and Angie's List—AI cross-references them.
Voice & TikTok: Voice search captures "in the moment" needs ("Alexa, find a lawn service"). TikTok works well for visual before-and-after content, but it shouldn't replace your core Google Ads and local search strategy.
Agentic AI Booking: The 2025-2026 Shift
Unlike chatbots that provide information, agentic AI autonomously executes tasks: booking appointments, processing payments, completing transactions—all without step-by-step human intervention.
How it works: Customer says, "I need an ant spray service on Wednesday afternoon, budget $150." AI finds providers, checks availability, books appointments, and handles payment—all in seconds.
Google's Project Mariner enables AI agents to complete tasks such as restaurant reservations and ticket purchases, with global expansion planned for 2026. OpenAI introduced shopping research and Instant Checkout in ChatGPT and launched its Apps SDK in October 2025, enabling Spotify, Zillow, Booking.com, and Expedia to integrate directly into conversations for 800 million weekly users.
The app advantage: Integrated apps surface automatically in ChatGPT conversations, providing interactive interfaces, maps, and full functionality without leaving the chat. This creates a strong bias toward businesses with direct integrations that companies can and should take advantage of.
But the future is open to everyone: Universal standards such as the Model Context Protocol (MCP), Web MCP, the Agentic Commerce Protocol, and Microsoft's NLWeb enable any business to connect its website, CRM, or booking system to AI agents. With ChatGPT ranking among the #4-5 most visited websites globally, this is about meeting customers where they already are—enabling complete workflows within the platforms where people spend their time. This levels the playing field, transforming AI chat tools into universal interfaces for commerce.
Get Ready Now
- Online booking enabled: This is the foundation agentic AI requires
- Transparent pricing published: AI needs data to make decisions
- Use appropriate schemas: They provide a machine-readable "map" of the above
- Ensure you have a technically sound website: From crawl-depth optimizations to optimized indexation.
- Eventually, consider partnering with MCP-supported providers: meet your customers where they are—in chatbots.
What Converts in 2025
With 60-65% of traffic coming from mobile devices, your marketing must be interactive and instant.
Content That Works
Users prefer opinionated content to neutral informational content in AI-generated summaries by a 3:1 margin, and “answer-first” content structures increase snippet and AI-surface inclusion by 15–25%. Still, none of that helps if you can't convert the customer.
- Show your expertise: With a consistent brand voice, build modular content that shares real, helpful stories from the field.
- Always-on AI booking: Engage all visitors, regardless of funnel position, and capture leads 24/7, even after hours.
- Authentic video: Smartphone clips of your team solving problems build more trust than polished ads and help you show up in AI search.
Channel Performance
- Google Ads: Still the intent leader. Focus on negative keywords. See our paid ads guide.
- Local Service Ads (LSA): Now in Google Maps and AI mode. Update "Job Types" to avoid bad leads. Latest LSA updates.
- Nextdoor: Hyper-local targeting with verified homeowners. Natural engagement wins here.
- Print: Physical mailers still build trust and recall. Print's not dead.
- SEO isn't dead: you're just doing it wrong.
Trust & Retention
Acquisition costs are rising. Profit lives in retention. AI agents heavily weigh review sentiment when recommending companies.
Reviews & Referrals
For service businesses, trust signals (licenses, certifications, staff bios, reviews, etc.) correlate with 30–60% higher conversion rates from organic and LLM referral traffic.
- Automate review requests: Send immediately after service
- Respond to everything: Silence signals indifference
- Referral programs: Referred customers have higher lifetime value
Build Loyalty
- Attraction: Clear value proposition and professional web design.
- Response: Be transparent and helpful. Showcase what makes you different.
- Commitment: Use automated re-booking to make staying with you effortless.
Your 12-Month Roadmap
Months 1-3: Foundation
- Enable online booking.
- Audit listings for NAP consistency (Google, Apple, Yelp, Bing).
- Implement systematic review generation.
- Enable IndexNow for 7-10% faster Bing indexing (used by ChatGPT).
Months 4-6: Optimization
- Rewrite FAQs to answer conversational questions (Who, What, Where, How much)
- Make customers (and AI) aware of your unique value, from discounts to green-friendly products.
- Launch Google Local Services if not active
- Add schema markup for services, FAQs, service areas, and pricing
Months 7-12: Expansion
- Start authentic video content on social channels
- Partner with booking platforms piloting AI integration
- Deploy AI-powered customer communication tools
Bottom Line
By 2026, instant AI booking will be a baseline market expectation. Companies that act now—implementing robust booking infrastructure, establishing transparent pricing models, and structuring their digital presence for AI discoverability—will capture market share. At the same time, competitors retroactively restructure their data to meet emerging standards such as NLWeb.
Ready to future-proof your growth? Contact the home services marketing experts at Coalmarch to navigate the agentic AI era.
Download 2026 Benchmark Report!


Claude responded: Google's search results are getting more visual — and that shift is starting to matter for pest and lawn operators in local search.Google's search results are getting more visual — and that shift is starting to matter for pest and lawn operators in local search. This blog breaks down what's changing with Google's ad formats, why your Google Business Profile photos are more important than ever, and how to build a real visual presence without hiring a photographer.